
You Can Be a Financial Analyst for Your Organization
- npabliss

- Apr 1, 2019
- 2 min read
Updated: May 29, 2019
Are You Ready to Take 3 Baby Steps to Analyze Your Financial Reports?
Congratulations! You just completed the first quarter of the year and now it’s time to take a deep dive and make some financial comparisons.
STEP 1: The first step is to make sure each month from the first quarter is properly closed out (Remember the handy Month-End Checklist I shared in February?)
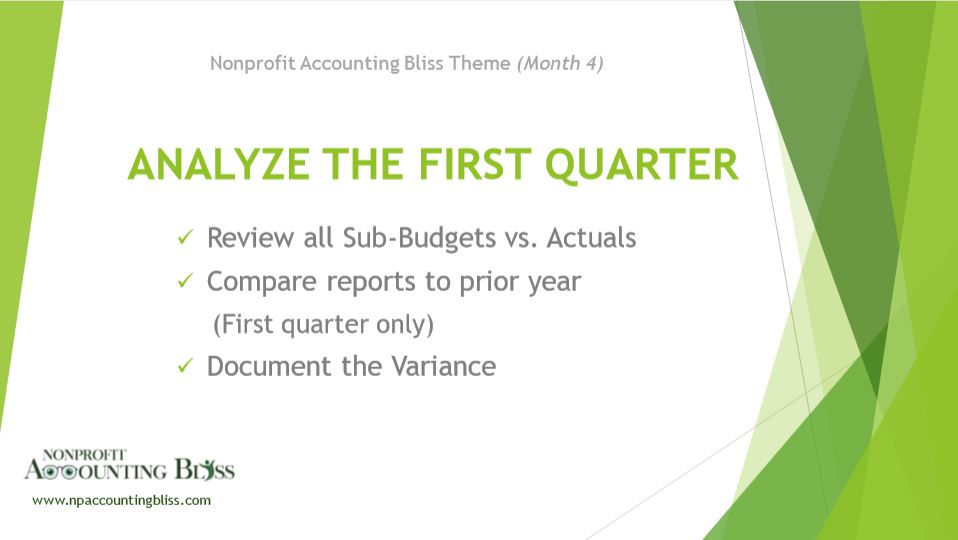
STEP 2: Once you’ve closed out your first quarter, I recommend you start by pulling the reports below for the entire first quarter.
1.) PRIOR/CURRENT YEAR- Profit/Loss (aka Statement of Activity) comparing this years transactions to last year (preferably in a side-by-side format)
2.) ALL PROGRAMS - Individual Program Budgets versus Actual Transactions
3.) ORGANIZATION - Refer to your full organizational budget compared to actual transactions (again, preferably in a side-by-side format)
Disclaimer: Two of the three reports are based on the hope that your organization has created a month-by-month (or at least quarter-by-quarter) budget breakdown. If your organization only has a full year budget, then you may only get value from the first recommended report, but you can still compare your year-to-date transactions to your full year budget. In the future, I recommend separating your budget by each quarter at the minimum so you may capture seasonal increases or decreases in your financial operations (More Training on this to come!)
Ultimately, my recommendation to review your first quarter is so you can interpret the story of your financial operations and see whether or not you are on track according to your expectations (budget) and/or your historical operations (prior year).
STEP 3: Once you’ve pulled your three reports, you want to 1) have a simple strategy as you analyze the financial data, then 2) document significant changes in the comparisons. Below is my suggested strategy and two examples for new nonprofits to start using.
Comparative Analysis Strategy: If there is a 25%+ decrease in the revenue and/or a 25%+ increase in your expenditures, take time to understand and document WHY.
For example:
Foundation Grants (Revenue): Current Year = $35,500 Prior Year = $50,000
Explanation - The grant revenue was lower this year due to a revised strategy to increase grant revenue in the summer so the staff can focus more on programming and utilize funds from fundraising efforts for operational expenses in the beginning of the year.
Wages/Salaries (Expense): Current Year = $49,370 Prior Year = $32,895
Explanation - The organization hired a full-time development director in January of the current year (Salary = $70,000) after the board approved the position
As you practice this strategy, it should draw your attention to current strengths and weaknesses so you can address them both appropriately. You may either celebrate and keep the momentum, or take quick action and course correct!
And remember, it’s so important to have a good understanding of your overhead (or administrative costs). If you want to learn more, check out this Overhead Project by CalNonprofits: https://calnonprofits.org/programs/overhead
![Deadlines are Fast Approaching [Demo - Month 1]](https://static.wixstatic.com/media/142c6a_2ebf4bc7dea646b8a8b2a35abefd26e0~mv2.jpg/v1/fill/w_960,h_540,al_c,q_85,enc_avif,quality_auto/142c6a_2ebf4bc7dea646b8a8b2a35abefd26e0~mv2.jpg)
![Intentional Accounting in 2020 [Checklist Included]](https://static.wixstatic.com/media/142c6a_149f640f12a3491cba1de02991464861~mv2.jpg/v1/fill/w_443,h_327,al_c,q_80,enc_avif,quality_auto/142c6a_149f640f12a3491cba1de02991464861~mv2.jpg)

Comments